Gemeinderatsprotokolle seit 2002
Jahr: 2019
/ Ausgabe: 10-Protokoll-21-11-2019.pdf
- S.279
Suchen und Blättern in über 500 PDFs und 44.000 Seiten.
Gesamter Text dieser Seite:
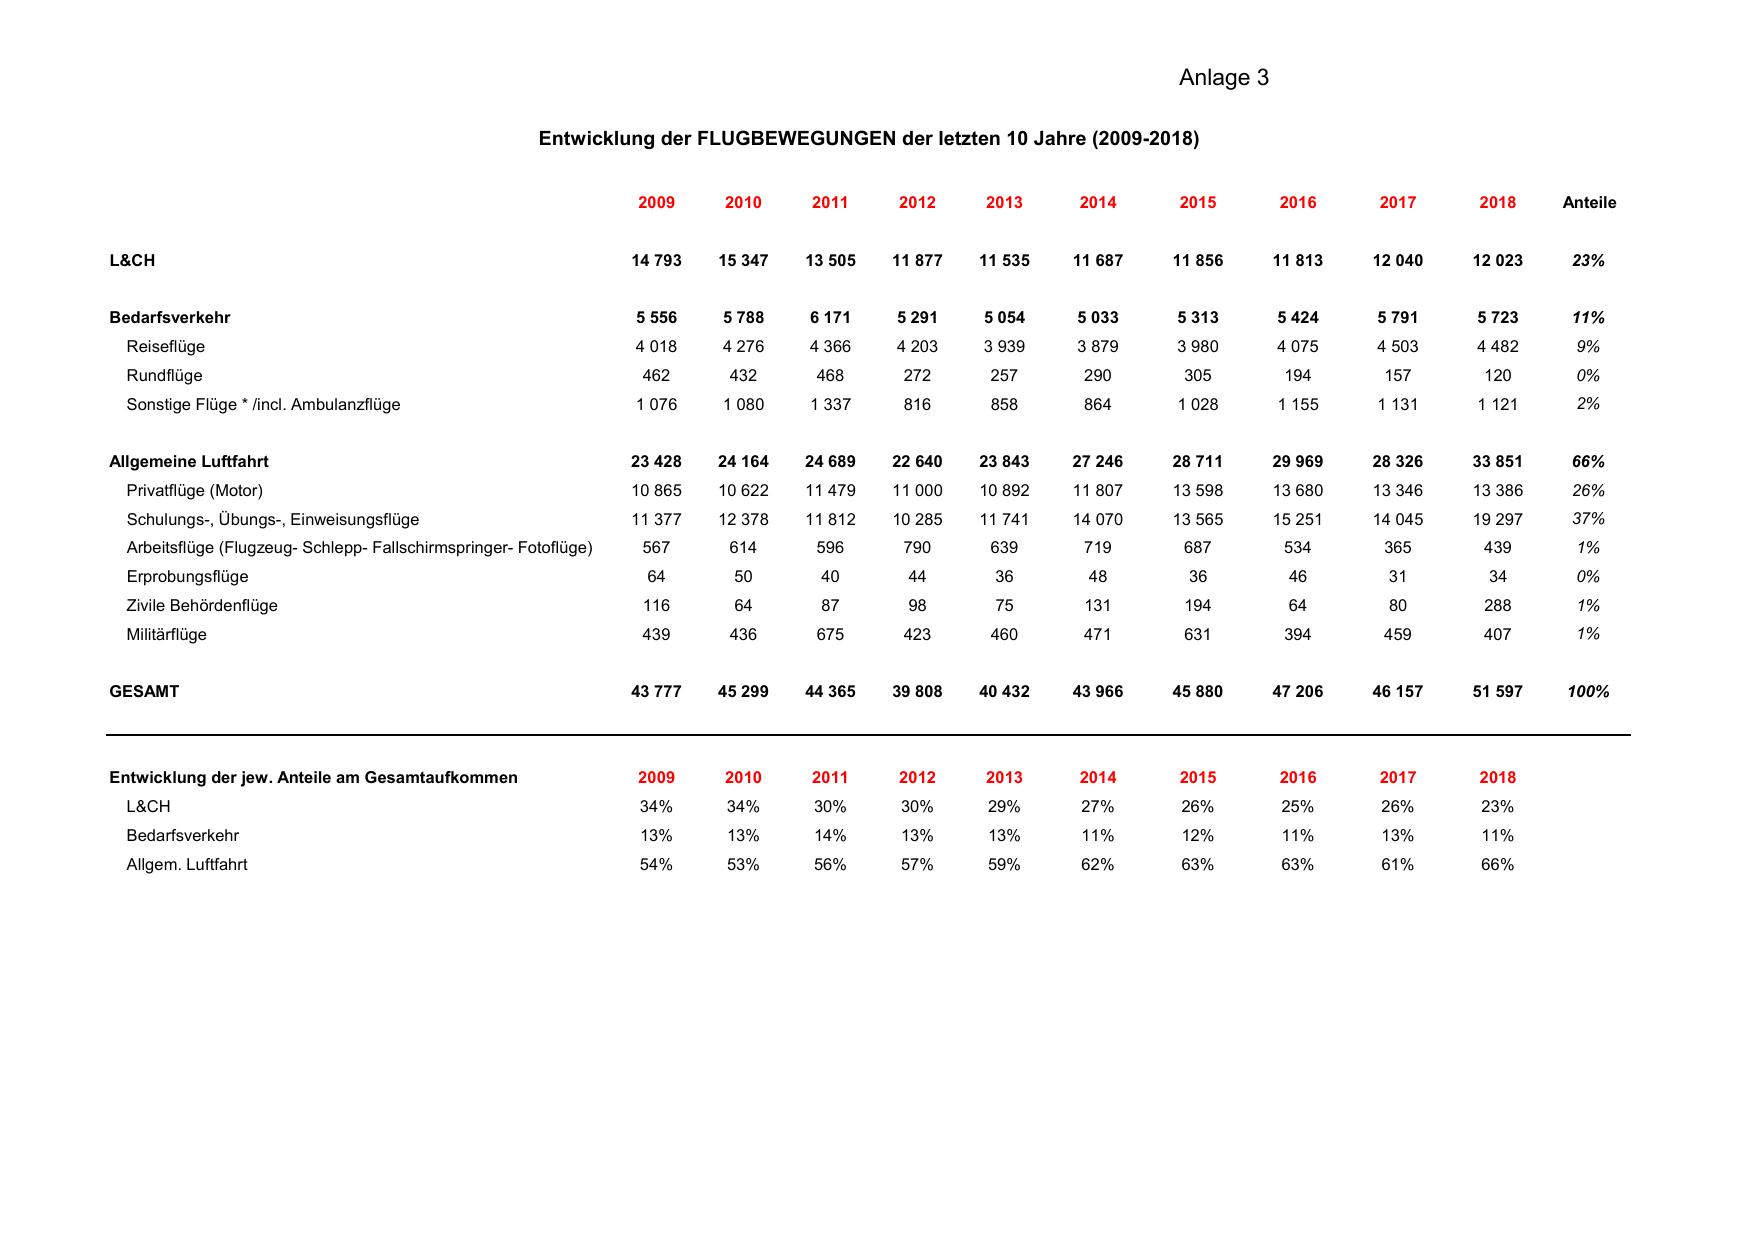
Anlage 3
Entwicklung der FLUGBEWEGUNGEN der letzten 10 Jahre (2009-2018)
2009
2010
2011
2012
2013
2014
2015
2016
2017
2018
Anteile
L&CH
14 793
15 347
13 505
11 877
11 535
11 687
11 856
11 813
12 040
12 023
23%
Bedarfsverkehr
5 556
5 788
6 171
5 291
5 054
5 033
5 313
5 424
5 791
5 723
11%
Reiseflüge
4 018
4 276
4 366
4 203
3 939
3 879
3 980
4 075
4 503
4 482
9%
Rundflüge
462
432
468
272
257
290
305
194
157
120
0%
Sonstige Flüge * /incl. Ambulanzflüge
1 076
1 080
1 337
816
858
864
1 028
1 155
1 131
1 121
2%
Allgemeine Luftfahrt
23 428
24 164
24 689
22 640
23 843
27 246
28 711
29 969
28 326
33 851
66%
Privatflüge (Motor)
10 865
10 622
11 479
11 000
10 892
11 807
13 598
13 680
13 346
13 386
26%
Schulungs-, Übungs-, Einweisungsflüge
11 377
12 378
11 812
10 285
11 741
14 070
13 565
15 251
14 045
19 297
37%
Arbeitsflüge (Flugzeug- Schlepp- Fallschirmspringer- Fotoflüge)
567
614
596
790
639
719
687
534
365
439
1%
Erprobungsflüge
64
50
40
44
36
48
36
46
31
34
0%
Zivile Behördenflüge
116
64
87
98
75
131
194
64
80
288
1%
Militärflüge
439
436
675
423
460
471
631
394
459
407
1%
GESAMT
43 777
45 299
44 365
39 808
40 432
43 966
45 880
47 206
46 157
51 597
100%
Entwicklung der jew. Anteile am Gesamtaufkommen
2018
2009
2010
2011
2012
2013
2014
2015
2016
2017
L&CH
34%
34%
30%
30%
29%
27%
26%
25%
26%
23%
Bedarfsverkehr
13%
13%
14%
13%
13%
11%
12%
11%
13%
11%
Allgem. Luftfahrt
54%
53%
56%
57%
59%
62%
63%
63%
61%
66%